
How to Estimate the Frequency Response of a Simulink Model
A core theme in Model-Based Design is
reusing your intellectual property for different tasks. Analysis for the purpose of design is a
critical benefit. Today I introduce Erman
Korkut to show how to estimate the frequency response of your Simulink
model.

 The first step is to create a “good” input signal for
frequency response estimation:
Creating input signals for frequency response estimation
By definition, frequency response estimation requires a
sinusoidal input to excite your system. Simulink Control Design
provides the frest.Sinestream
command to create such a signal.
Let’s create a set of sinusoids with 30 frequencies, varying
between 0.1 and 10 rad/s. These are the frequencies that we want to compute the
model’s response for:
The first step is to create a “good” input signal for
frequency response estimation:
Creating input signals for frequency response estimation
By definition, frequency response estimation requires a
sinusoidal input to excite your system. Simulink Control Design
provides the frest.Sinestream
command to create such a signal.
Let’s create a set of sinusoids with 30 frequencies, varying
between 0.1 and 10 rad/s. These are the frequencies that we want to compute the
model’s response for:
 Confirming whether your frequency response estimation is
good
The frest.simView
command lets you analyze your frequency response estimation results.
Confirming whether your frequency response estimation is
good
The frest.simView
command lets you analyze your frequency response estimation results.
 The frequency response is the
plot at the bottom where the frequency points are color-coded. You can use the
slider on the frequency response plot to interactively explore the time
response and the FFT at each frequency of the input. In the time response plot,
the steady state portion of the output signal is the thick line. The FFT plot
shows the spectrum corresponding to this output signal. At the selected
frequency of 0.1 rad/s, the time response includes transients during the first
period but reaches steady state afterwards.
Sometimes, it takes a couple of tries to get good estimation
results. For example, it is possible that you need an input with different
amplitude, or you need to increase number of periods to drive the system to
steady state. The time and FFT plots in simulations results viewer help you
identify such issues which you can address by changing the parameters of your
input signal.
You can learn more about frequency response estimation in
our documentation
and demos.
Now it is your turn
Do you estimate the frequency response of your Simulink
models? Try estimating the frequency response of your Simulink model and share how it goes.
The frequency response is the
plot at the bottom where the frequency points are color-coded. You can use the
slider on the frequency response plot to interactively explore the time
response and the FFT at each frequency of the input. In the time response plot,
the steady state portion of the output signal is the thick line. The FFT plot
shows the spectrum corresponding to this output signal. At the selected
frequency of 0.1 rad/s, the time response includes transients during the first
period but reaches steady state afterwards.
Sometimes, it takes a couple of tries to get good estimation
results. For example, it is possible that you need an input with different
amplitude, or you need to increase number of periods to drive the system to
steady state. The time and FFT plots in simulations results viewer help you
identify such issues which you can address by changing the parameters of your
input signal.
You can learn more about frequency response estimation in
our documentation
and demos.
Now it is your turn
Do you estimate the frequency response of your Simulink
models? Try estimating the frequency response of your Simulink model and share how it goes.
- Have you ever estimated frequency response of your Simulink models?
- Have you ever tried to create “good” input signals for this purpose?
- Have you ever tried to automate this process by writing scripts to modify your model for simulation using the designed input, and to process the results for estimation?
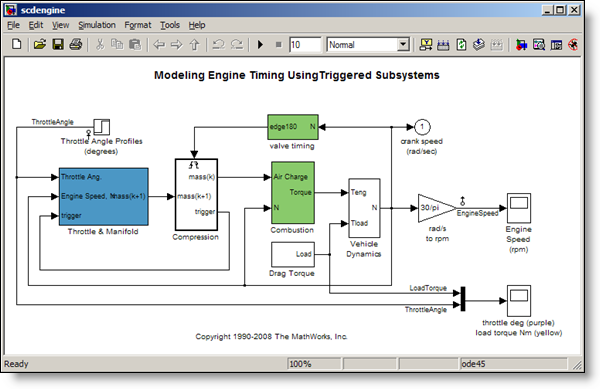
>> scdengine >> mdl = 'scdengine';
The first step is to create a “good” input signal for
frequency response estimation:
Creating input signals for frequency response estimation
By definition, frequency response estimation requires a
sinusoidal input to excite your system. Simulink Control Design
provides the frest.Sinestream
command to create such a signal.
Let’s create a set of sinusoids with 30 frequencies, varying
between 0.1 and 10 rad/s. These are the frequencies that we want to compute the
model’s response for:
>> in = frest.Sinestream('Frequency',linspace(0.1,10,30))
The sinestream input signal: Frequency : [0.1 0.44138 0.78276 1.1241 ...] (rad/s) Amplitude : 1e-005 SamplesPerPeriod : 40 NumPeriods : 4 RampPeriods : 0 FreqUnits (rad/s,Hz): rad/s SettlingPeriods : 1 ApplyFilteringInFRESTIMATE (on/off) : on SimulationOrder (Sequential/OneAtATime): Sequential The resulting sinestream input signal has several adjustable parameters; including the frequencies, amplitude, the number of periods etc. The SettlingPeriods parameter is especially important. This parameter specifies the period of your response where after the system is assumed to be at steady state. This parameter helps you ensure that the frequency response estimation focuses on the steady state portion of the response. The Sinestream signal is the best input signal for frequency response estimation, because with this signal you can isolate steady state portion of the response. However, you can also design and use other types of input signals. For example, you can create a frequency sweep (chirp) using the frest.Chirp command or create a random signal with the command frest.Random. You can also use a timeseries object to specify a custom input signal. Estimating the frequency response After you create an input signal for frequency response estimation, the next step is to run simulation using this input to obtain the output signals and use this data to estimate the frequency response. Simulink Control Design combines these steps in the frestimate command:>> [sysest,simout] = frestimate(mdl,getlinio(mdl),in);
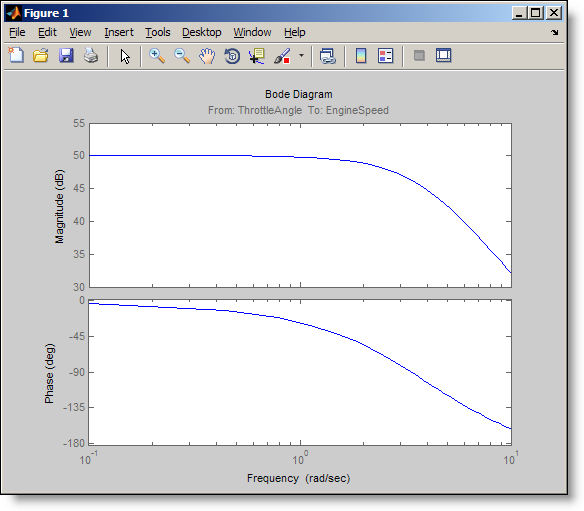
The syntax of frestimate is very similar to linearize. You must specify the model, the linearization input/output points and the input signal you designed. In our model, the linearization input and output points are already set at the throttle angle and the engine speed signals and you get them using getlinio. frestimate automatically performs simulation(s) where designed input signal is inserted from the specified input point(s) and the specified output signal(s) are logged. It uses the obtained output signals to estimate the frequency response. It returns the estimated response as a frequency response data object, sysest, and the simulation outputs in simout. The nice thing about the frestimate is that it injects the input signal and runs the simulation logging the outputs without requiring you to change your model. You specify input and output points to be anywhere in your model and frestimate takes care of the rest! Let’s look at the Bode plot of the estimated frequency response.>> bode(sysest)
Confirming whether your frequency response estimation is
good
The frest.simView
command lets you analyze your frequency response estimation results.
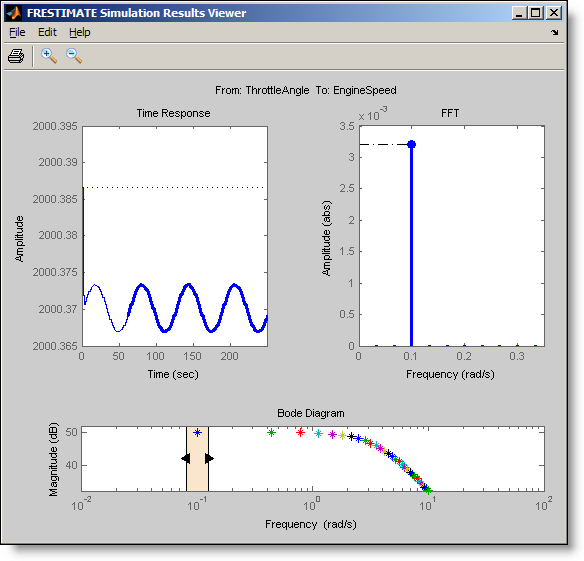
>> frest.simView(simout,in,sysest);
The frequency response is the
plot at the bottom where the frequency points are color-coded. You can use the
slider on the frequency response plot to interactively explore the time
response and the FFT at each frequency of the input. In the time response plot,
the steady state portion of the output signal is the thick line. The FFT plot
shows the spectrum corresponding to this output signal. At the selected
frequency of 0.1 rad/s, the time response includes transients during the first
period but reaches steady state afterwards.
Sometimes, it takes a couple of tries to get good estimation
results. For example, it is possible that you need an input with different
amplitude, or you need to increase number of periods to drive the system to
steady state. The time and FFT plots in simulations results viewer help you
identify such issues which you can address by changing the parameters of your
input signal.
You can learn more about frequency response estimation in
our documentation
and demos.
Now it is your turn
Do you estimate the frequency response of your Simulink
models? Try estimating the frequency response of your Simulink model and share how it goes. - Category:
- Analysis,
- Controls,
- Guest Blogger,
- What's new?


Comments
To leave a comment, please click here to sign in to your MathWorks Account or create a new one.